Back to Home
Scroll Down
🚀 Intensive Training Program

Power BI
Supercharged

80-Hour Structured Program + 20-Hour Capstone Projects

Transform Your Data Into Actionable Insights

Master Power BI from foundations to enterprise-grade solutions

Power BI Dashboard

Why Choose HERE AND NOW AI?

Industry-Oriented Curriculum

Structured learning path aligned with real-world industry needs and current market standards

Expert Instructors

Learn from seasoned professionals with extensive real-world BI and analytics experience

Multi-Department Alignment

Seamless dataset integration across departments for comprehensive, holistic learning

Scenario-Based Learning

Practical, hands-on approach with real business scenarios to build job-ready skills

Proven Framework

Battle-tested capability-building methodology that delivers measurable results

What You'll Master

Transform yourself into a Power BI expert

Build Complete Analytics Dashboards

Create end-to-end analytics solutions from data ingestion to stunning visualizations

Advanced Data Modelling

Master data modelling techniques and optimization strategies for peak performance

DAX-Driven Analytics

Develop powerful DAX formulas for complex business calculations and metrics

ETL Pipeline Mastery

Implement robust Power Query-based ETL pipelines for seamless data transformation

Enterprise Solutions

Publish, secure, and manage enterprise-grade BI solutions with confidence

Professional Insights

Deliver executive-level insights that drive strategic decision-making

Program Structure

0
Hours of Training

Comprehensive modules covering every aspect of Power BI

0
Hours Capstone Project

Real-world application with mentor guidance

0+
Core Modules

From basics to advanced enterprise techniques

Data Transformation
01
Module 01

Introduction to Power BI & Data Landscape

Your Journey Begins Here

Lay the foundation for your Power BI mastery with comprehensive fundamentals

  • Understanding BI fundamentals and data-driven decision-making frameworks
  • Complete Power BI Desktop interface walkthrough and navigation
  • Connecting to diverse data sources: Excel, CSV, Web, and more
  • Basic data exploration, profiling, and quality assessment techniques
02
Module 02

Power Query Basics

Data Cleaning & Preparation

Power Query
  • Master data types, transformations, and handling missing values
  • Splitting, merging, trimming, and formatting columns like a pro
  • Navigate the Power Query Editor environment with confidence
  • Build reliable, clean datasets ready for analysis
03
Module 03

Working With Multiple Data Sources

Excel & CSV

Import and combine spreadsheet data efficiently

SQL Databases

Connect to enterprise database systems

Cloud Services

Integrate with Azure, AWS, and web APIs

  • Importing, appending, and combining datasets from multiple sources
  • Understanding structured vs semi-structured data sources
  • Establishing data cleanliness and consistency across sources
  • Using profiling tools for comprehensive data quality evaluation
04
Module 04

Data Modelling Foundations

Star Schema

Centralized fact table surrounded by dimension tables for optimal query performance

Snowflake Schema

Normalized dimension tables for complex data relationships

  • Understanding relationship types and cardinality (1:1, 1:M, M:M)
  • Configuring cross-filter direction and its business implications
  • Building foundational data models that scale
  • Best practices for model optimization and performance
05
Module 05

Core DAX

Data Analysis Expressions

DAX Formulas

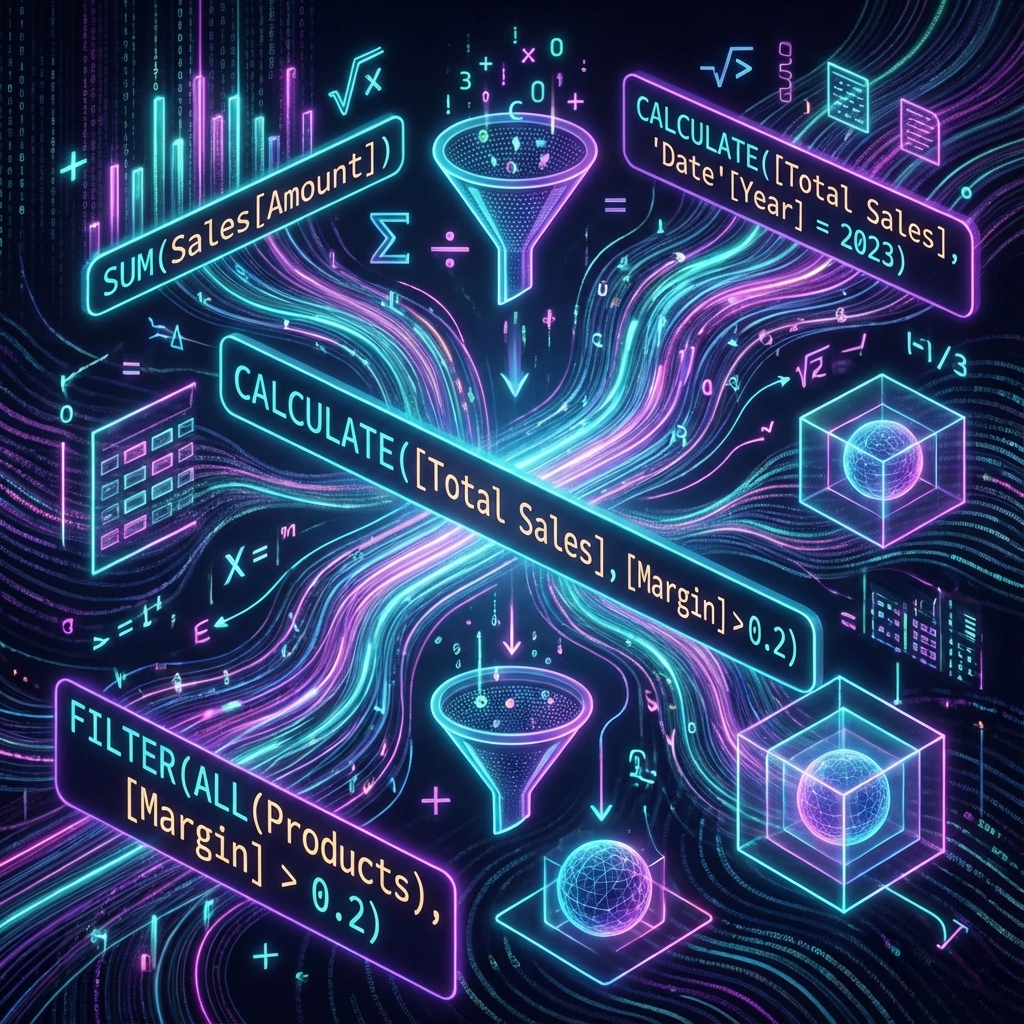
Master the Language of Power BI

DAX is the powerhouse behind every calculation in Power BI. Learn to wield it like a pro!

  • Master the difference between measures and calculated columns
  • Core aggregations: SUM, AVERAGE, MIN/MAX, DISTINCTCOUNT
  • Understanding filter context and row context fundamentals
  • Building beginner-level KPIs and business metrics
06
Module 06

Intermediate DAX & Context Transition

CALCULATE

Modify filter context

FILTER

Create custom filters

Context Transition

Row to filter context

  • CALCULATE, FILTER, and functional combinations for dynamic metrics
  • Context transition explained with real-world, practical examples
  • KPI logic building tailored for different business departments
  • Creating dynamic calculations and flexible metric definitions
07
Module 07

Time Intelligence Essentials

Time Intelligence

Date Table Creation

Build proper Calendar tables for robust time-based analysis

Period Calculations

Master YTD, MTD, QTD for business reporting

YoY Comparisons

Year-over-Year metrics for trend analysis

Moving Averages

Rolling averages and forecasting windows

08
Module 08

Data Visualisation Principles

Tell Compelling Stories With Data

Transform raw numbers into visual narratives that drive action

Bar Charts

Line Graphs

Pie Charts

Tables

Geo Maps

KPI Cards

  • Choosing the right chart type for your data story
  • Mastering KPI cards, slicers, tooltips, and formatting
  • Data storytelling fundamentals and narrative techniques
  • Enhancing readability and visual flow for maximum impact
09
Module 09

Advanced Visuals & Interactive Components

Advanced Dashboard
  • Matrix drill-downs and hierarchical visual navigation
  • Conditional formatting for instant data insights
  • Geo-maps and location-based analytics
  • Custom tooltips and user-guided navigation flows
  • Bookmarks, buttons, and interactive page navigation
Capstone Project

Bring It All Together

20
Hours of Hands-On Work

Apply everything you've learned to a real-world project

Your Portfolio Project

  • Full integration of all skills learned throughout the program
  • KPI identification and business problem definition with mentors
  • End-to-end project development from data to dashboard
  • Regular review meetings and troubleshooting sessions
  • In-depth follow-up for real-world use case refinement

Build a portfolio project that showcases your expertise!

Ideal for Multi-Departmental Teams

Empowering teams across your entire organization

Finance

Financial reporting, budgeting, variance analysis, and forecasting

Engineering

Manufacturing metrics, quality control, and process optimization

Production

Production planning, capacity analysis, and efficiency tracking

Purchase

Vendor analysis, cost tracking, and procurement insights

Procurement

Supply chain analytics and inventory management

Administration

Organizational dashboards and cross-functional reporting

Ready to Transform
Your Career?

Join the Power BI Supercharged Program Today

Enroll Now!

Contact us to learn more about enrollment, upcoming batches, and exclusive offers

Contact Our Team Back to Home
www.hereandnowai.com
"Innovate to Lead, Code to Change"